For the last weeks I’ve been catching up / deep diving on AWS Cloud platform – one of the more important components are EBS – which delivers foundation for a lot of other services including the things you build yourself within AWS – thus performance characteristics matters.
Normally organizations would be moving of Dell EMC , NetApp or similar enterprise grade storage – with a different set of performance characteristics – thus trying to create a comparison matters.
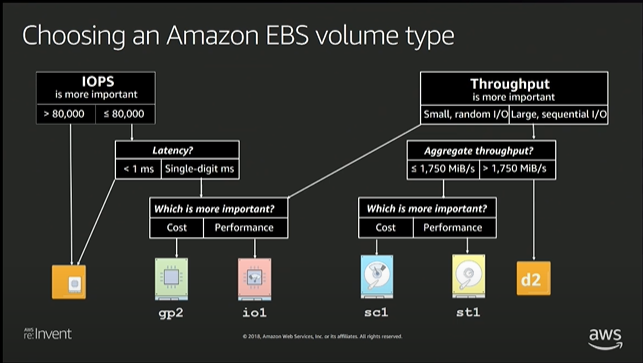
This video from re:invent describes a lot of good details about how to select an EBS volume type.
This looks a lot like the storage classes that can be build and setup using Ceph as a component in an internal setup – and has the same pro/con and limitations.
One of the limitations that are not that well highlighted is the impact on Single threaded IOPS – above 80.000 are really really nice – but it is aggregated performance – to compute the actual number of single threaded IOPS below fio benchmark can be used.
ubuntu@ip-172-31-11-218:/tmp$ fio --name rand-write --filename fio-rand-write --size 1g --ioengine libaio --bs 4K --direct 1 --numjobs 1 --fsync 1 --runtime 30s --readwrite randwrite
 rand-write: (g=0): rw=randwrite, bs=(R) 4096B-4096B, (W) 4096B-4096B, (T) 4096B-4096B, ioengine=psync, iodepth=1
 fio-3.16
 Starting 1 process
 Jobs: 1 (f=1): [w(1)][100.0%][w=4308KiB/s][w=1077 IOPS][eta 00m:00s]
 rand-write: (groupid=0, jobs=1): err= 0: pid=80915: Fri Dec 11 08:08:46 2020
   write: IOPS=1145, BW=4581KiB/s (4690kB/s)(134MiB/30001msec); 0 zone resets
     clat (usec): min=391, max=14333, avg=630.60, stdev=274.88
      lat (usec): min=391, max=14334, avg=630.70, stdev=274.88
     clat percentiles (usec):
      |  1.00th=[  453],  5.00th=[  461], 10.00th=[  469], 20.00th=[  486],
      | 30.00th=[  523], 40.00th=[  545], 50.00th=[  562], 60.00th=[  603],
      | 70.00th=[  644], 80.00th=[  717], 90.00th=[  865], 95.00th=[  979],
      | 99.00th=[ 1385], 99.50th=[ 1713], 99.90th=[ 3064], 99.95th=[ 4228],
      | 99.99th=[10421]
    bw (  KiB/s): min= 3408, max= 5640, per=100.00%, avg=4589.85, stdev=562.90, samples=59
    iops        : min=  852, max= 1410, avg=1147.42, stdev=140.73, samples=59
   lat (usec)   : 500=25.32%, 750=56.59%, 1000=13.74%
   lat (msec)   : 2=4.02%, 4=0.27%, 10=0.05%, 20=0.01%
   fsync/fdatasync/sync_file_range:
     sync (nsec): min=888, max=20496k, avg=241159.70, stdev=577087.71
     sync percentiles (nsec):
      |  1.00th=[     916],  5.00th=[     924], 10.00th=[     932],
      | 20.00th=[     956], 30.00th=[     980], 40.00th=[    1032],
      | 50.00th=[    1144], 60.00th=[    1304], 70.00th=[    1624],
      | 80.00th=[    2544], 90.00th=[ 1187840], 95.00th=[ 1400832],
      | 99.00th=[ 1859584], 99.50th=[ 2179072], 99.90th=[ 3915776],
      | 99.95th=[ 5668864], 99.99th=[12255232]
   cpu          : usr=0.44%, sys=1.43%, ctx=42950, majf=0, minf=12
   IO depths    : 1=200.0%, 2=0.0%, 4=0.0%, 8=0.0%, 16=0.0%, 32=0.0%, >=64=0.0%
      submit    : 0=0.0%, 4=100.0%, 8=0.0%, 16=0.0%, 32=0.0%, 64=0.0%, >=64=0.0%
      complete  : 0=0.0%, 4=100.0%, 8=0.0%, 16=0.0%, 32=0.0%, 64=0.0%, >=64=0.0%
      issued rwts: total=0,34355,0,34354 short=0,0,0,0 dropped=0,0,0,0
      latency   : target=0, window=0, percentile=100.00%, depth=1
 Run status group 0 (all jobs):
   WRITE: bw=4581KiB/s (4690kB/s), 4581KiB/s-4581KiB/s (4690kB/s-4690kB/s), io=134MiB (141MB), run=30001-30001msec
 Disk stats (read/write):
   nvme0n1: ios=381/46662, merge=380/6186, ticks=186/29297, in_queue=240, util=99.71%
 ubuntu@ip-172-31-11-218:/tmp$
Long output – but I have highlighted the most important corners – avg latency (and also max).
So – the single threaded IOPS on EBS is approximately 1100 – which quite ok for a NAS/SAN or Software Defined Storage. But it actually means that if your application should use those 80.000 IOPS in the decision tree above it need to be capable of spreading IO over “at least” 80 parallel processes/threads or issue asynchronous IO to utillize those 80K IOPS.
Depending on what type of work your application does – then it may be excessively hard to do that.
This should be compared to a server with a local NVMe drive. This tweaktown image (article) depicts equivalent numbers from a Micron 9300 MAX NVMe drive and the comparable number is 40-45.000 IOPS or approximately 40x better.
Wonder if you current AWS instance suffers from lacking IO performance? – Processes stuck in state D in top, wait in dstat over 5 – would be clear indication.
Conclusion
There is a few key takeaways:
- If you do migration – try to benchmark as above – where you’re coming from to where you’re heading – to avoid surprises.
- You can get way better performance in AWS Instance stores – but there is no way to persist data over instance reboots (you need to do that at the application side)
- If you can re-architect your application to be cloud-native / horizontally scalable then this fits excellent together. Cranking up concurrency is the way forward for performance here.
- Do not – without careful consideration and benchmark move an application from direct attached NVMe/SSD to EBS – as they have performance characteristics that are much higher/better than EBS.
- I have not practically managed go get the benchmark over 20K IOPS even with 64K provisioned IOPS and high queue-depth/concurrency – but I may be missing tweaks here.
- Test – if you can just clone your system and do the move – that would be the best test.
One criticism could be: why do you benchmark random write performance?
There is a few good reasons. As much as random read performance is excessively important for application performance – memory is also very, very cheap and the OS (Linux / Windows) does a very good job at caching data locally and even getting high-memory instances and sequential performance is usually just dominated by the network bandwidth.